What Australian Kids Actually Do (Every State Compared, 2025 Data)
18 September 2026
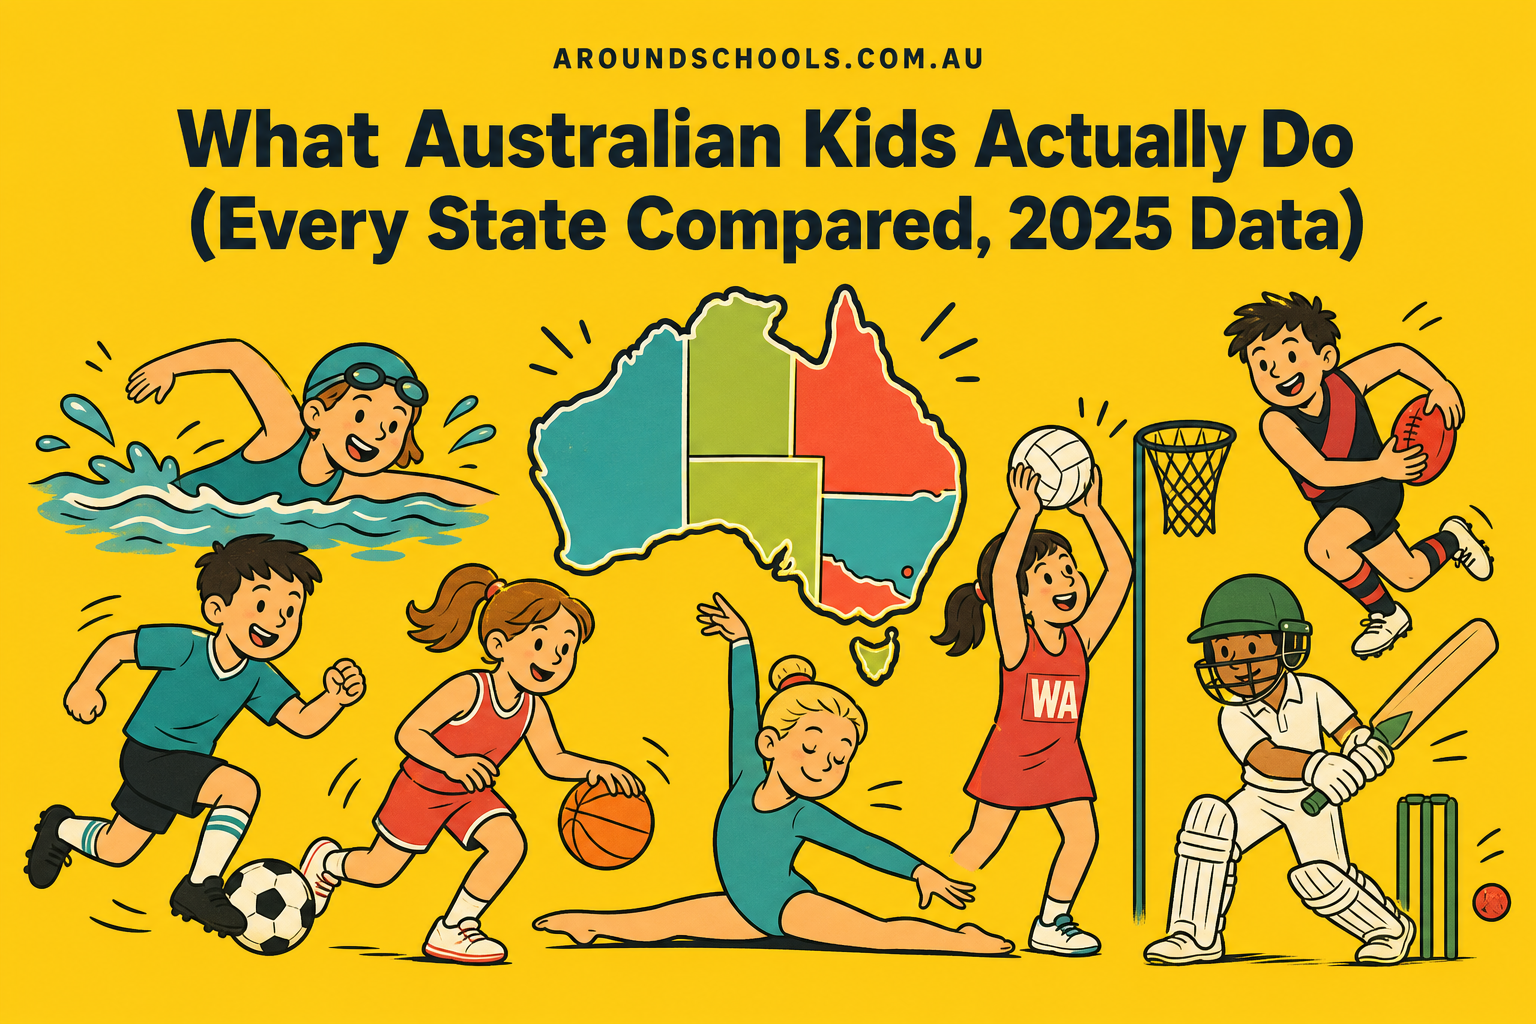
Swimming is the most common organised activity for Australian children, and it is not close - 23.3% of all children swim outside school hours, against 14.3% for the next most common, soccer. Swimming leads in all eight states and territories, which nothing else does.
Underneath that national picture the states diverge sharply, and so do boys and girls. This is the national view; we have written a companion piece for each state with its own numbers, linked throughout.
Everything here comes from AusPlay, the Australian Sports Commission's participation survey, covering January to December 2025 and released on 30 April 2026. We pulled the tables directly and print the margin of error beside every figure.
Key takeaways
- Swimming leads nationally at 23.3% (±4%), and is first in every state and territory.
- Netball is the most gender-split activity Australian children do - 9.5% of girls against 0.6% of boys, about 15.8 to 1.
- Swimming is the most even of the big activities, at about 1.00 to 1.
- The spread between states is wide: swimming runs from 19.2% in Western Australia to 31.3% in the ACT.
- Sample size limits what can be said about small jurisdictions - NSW supports 25 reliable activity estimates, the Northern Territory just 2.
The national top ten
| Activity | All children | Boys | Girls | Margin of error |
|---|---|---|---|---|
| Swimming | 23.3% | 22.4% | 24.3% | ±4% |
| Soccer | 14.3% | 21.3% | 7.1% | ±5.5% |
| Basketball | 7.1% | 9.3% | 4.7% | ±8.6% |
| Gymnastics | 7% | 3.1% | 11.1% | ±8.7% |
| Australian football | 5.9% | 8.7% | 2.9% | ±9.4% |
| Recreational dancing | 5.7% | 1.1% | 10.6% | ±9.5% |
| Netball | 5% | 0.6% | 9.5% | ±10% |
| Tennis | 3.9% | 4.3% | 3.5% | ±11.1% |
| Cricket | 3.4% | 5.3% | 1.4% | ±12.2% |
| Athletics | 3.2% | 2.8% | 3.8% | ±12.5% |
Two things stand out. Swimming is treated by Australian parents as a safety skill rather than a sport, which is why it sits so far clear of everything else and why it is the one activity boys and girls do at nearly the same rate. And the codes that dominate the national conversation - AFL, cricket, rugby - are each done by well under a tenth of children.
Boys and girls are doing different things, and the gap is enormous
This is the finding worth sitting with. Across the activities with a reliable national sample:
- Netball runs about 15.8 to 1 towards girls (9.5% of girls, 0.6% of boys).
- Recreational dancing runs about 9.6 to 1 towards girls (10.6% of girls, 1.1% of boys).
- DanceSport runs about 7.9 to 1 towards girls (5.5% of girls, 0.7% of boys).
- Cricket runs about 3.8 to 1 towards boys (5.3% of boys, 1.4% of girls).
- Soccer runs about 3.0 to 1 towards boys (21.3% of boys, 7.1% of girls).
- Australian football runs about 3.0 to 1 towards boys (8.7% of boys, 2.9% of girls).
Netball at 15.8 to 1 is the most segregated thing Australian children do. Only 0.6% of boys play it. The reverse case, cricket, is nowhere near as lopsided.
We are not arguing about whether that should be true. The practical point for a parent is narrower: if your child wants to do something where their sex is outnumbered ten to one, they may be the only one in the room. That is fine for some children and quietly awful for others, and it is worth asking the club how many kids of your child's sex are actually registered in their age group before you pay for a season.
Every state compared
Swimming wins everywhere, but the margin and the runner-up change a lot by where you live.
| State or territory | Swimming | Next most common | Reliable estimates | Full breakdown |
|---|---|---|---|---|
| New South Wales | 23.9% | Soccer 18.2% | 25 | New South Wales → |
| Victoria | 25.4% | Basketball 11% | 20 | Victoria → |
| Queensland | 22.9% | Soccer 14% | 22 | Queensland → |
| Western Australia | 19.2% | Soccer 13.8% | 14 | Western Australia → |
| South Australia | 20% | Soccer 12.3% | 10 | South Australia → |
| Tasmania | 20.1% | Soccer 17.1% | 5 | Tasmania → |
| ACT | 31.3% | Soccer 19.7% | 4 | ACT → |
| Northern Territory | 20.4% | Soccer 13.5% | 2 | Northern Territory → |
The runner-up column is the interesting one. It tracks the football code that owns each state: soccer through New South Wales, Queensland and the ACT; Australian football and basketball through Victoria, South Australia and Western Australia.
Read your own state
Each of these has the full activity table for that state, boys against girls, the age curve, and the local voucher that pays for part of it.
- What kids do in New South Wales - 25 activities with a reliable sample, led by swimming at 23.9%.
- What kids do in Victoria - 20 activities with a reliable sample, led by swimming at 25.4%.
- What kids do in Queensland - 22 activities with a reliable sample, led by swimming at 22.9%.
- What kids do in Western Australia - 14 activities with a reliable sample, led by swimming at 19.2%.
- What kids do in South Australia - 10 activities with a reliable sample, led by swimming at 20%.
- What kids do in Tasmania - 5 activities with a reliable sample, led by swimming at 20.1%.
- What kids do in ACT - 4 activities with a reliable sample, led by swimming at 31.3%.
- What kids do in Northern Territory - 2 activities with a reliable sample, led by swimming at 20.4%.
The number that should worry everyone
Participation peaks in primary school and falls away through the early teens, in every state and in almost every activity. In South Australia, swimming goes from 32.7% of children aged 5 to 8 down to 5.9% of those aged 12 to 14. In New South Wales it is 31.8% down to 14.3%.
The window in which a child forms a lasting habit is narrower than most parents assume, and it closes around the start of high school. That is an argument for breadth early rather than early specialisation - a child who has tried six things at nine has more to fall back on at fourteen than one who has done a single sport since five.
What this data cannot tell you
It is a survey, not a census. Every figure is an estimate with a range. We have only published activities where the relative margin of error is under 50%, the line the Australian Bureau of Statistics treats as reliable. For small jurisdictions that is a hard limit: the Northern Territory supports 2 reliable activity estimates and Tasmania 5, against 25 for New South Wales.
It excludes school sport. These are activities organised outside school hours, which is why the rates look lower than you would expect.
It is a new baseline. The Sports Commission states that 2023 to 2025 data cannot be compared directly with AusPlay figures published before 2023. Any older percentage you see quoted elsewhere is not a like-for-like comparison.
Where your child can actually do these things
Knowing swimming leads nationally tells you nothing about what is ten minutes from your house. Browse the kids' activities directory for what is listed near you, or start from your state: NSW, Victoria, Queensland, WA, SA, Tasmania, ACT and NT. The counts behind those pages come from our Kids' Activity Index.
Our coverage of parks, swimming venues, tennis and martial arts is good. Our club-sport coverage is patchy and uneven between states, and we would rather say so than have you assume a code is missing locally because it is missing from us.
Questions parents ask
What is the most popular sport for Australian kids? Swimming, at 23.3% of all children, well ahead of soccer at 14.3%. Swimming leads in every state and territory.
What do girls play most? Swimming, then Gymnastics. Netball, dancing and gymnastics are where girls outnumber boys most heavily.
What do boys play most? Swimming and soccer, close together, then basketball.
At what age do children drop out? Participation peaks around ages 5 to 8 and falls through 12 to 14 almost everywhere.
Is this school sport? No - organised activity outside school hours only.
Source: AusPlay, Australian Sports Commission, January to December 2025, released 30 April 2026. National and state tables pulled directly; margins of error from the same release. Facility counts are AroundSchools data as at 13 September 2026.