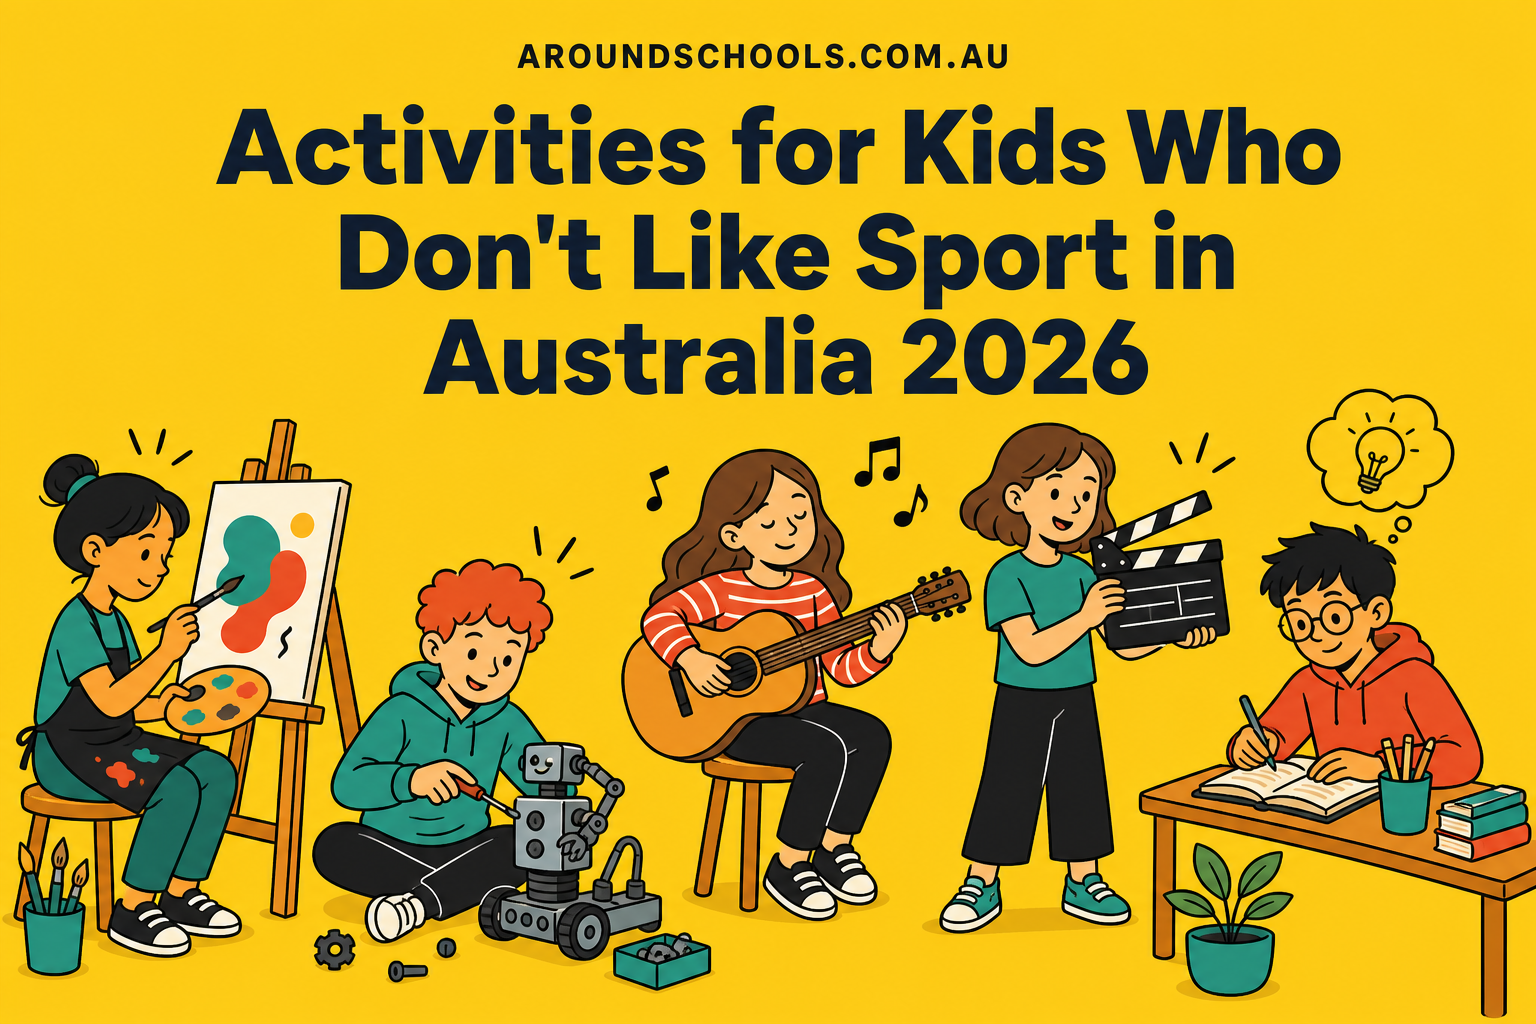
Activities for Kids Who Don't Like Sport in Australia 2026
10 September 2026
If your child is not a sporty kid, the shortage you are running into is real and it is measurable. Across the 7,949 kids' activities listed on AroundSchools as at 5 September 2026, 87% are sport. Music is 0.8% — 65 listings for the entire country. And of the 2,846 suburbs that list any kids' activity at all, 2,100 of them list sport and nothing else.
That is the practical problem behind a question we get asked a lot: what do you do with a child who has tried Saturday soccer and hated it? This is what the data says is actually out there, where the alternatives cluster, and how to search when your suburb comes up empty.
Key takeaways
- Sport is 87.1% of listed kids' activities nationally — 6,926 of 7,949.
- There are 106 sport listings for every one music listing. Only 60 suburbs in Australia list a music activity at all.
- 73.8% of suburbs with any listed activity are sport-only. Just 746 of 2,846 offer a non-sport option.
- The non-sport share barely moves by state: from 15.1% in the ACT down to 11.2% in Tasmania. There is no state where this is solved.
- Creative arts is the biggest alternative at 410 listings, then tutoring and academic at 352.
- This measures what is listed and findable, not everything that exists — an important difference we explain below.
Why this happens, and what it does not mean
Two honest caveats, because they change how you should read the numbers.
This is a map of what is listed, not a census of Australia. Sporting clubs are the most systematically catalogued kids' activities in the country — junior football, netball and cricket clubs are registered, affiliated and published by their state bodies, so they arrive in a directory in bulk. A single piano teacher with six students on a Tuesday afternoon does not. So some of that 87% is a discoverability gap rather than a supply gap.
But the discoverability gap is the parent's problem too. If a music teacher, drama class or art studio near you is not findable in any of the obvious places, it may as well not exist for a parent doing a Sunday-night search. The 106-to-1 ratio is a fair description of what a family actually encounters when they go looking.
What the number is not is a judgement about sport. Sport is genuinely the backbone of Australian childhood activity. The point is narrower: if sport is not the answer for your child, the search gets dramatically harder, and almost nobody tells you that in advance.
Where the alternatives actually are
The non-sport share is remarkably flat across the country — every state and territory sits between 11% and 16%. Nowhere has solved this.
At suburb level the picture is more concentrated than the state averages suggest. These are the suburbs listing the most non-sport options nationally:
| Suburb | Non-sport options | What kinds |
|---|---|---|
| Adelaide, SA | 9 | Academic, creative arts, entertainment, health |
| Sydney, NSW | 7 | Creative arts, entertainment, academic, health |
| Southbank, VIC | 6 | Entertainment, creative arts |
| Box Hill, VIC | 5 | Creative arts, academic, music |
| Castle Hill, NSW | 5 | Entertainment, health, creative arts, academic |
| Chatswood, NSW | 5 | Academic, music, creative arts |
| Glen Waverley, VIC | 5 | Academic, music |
| Hornsby, NSW | 5 | Creative arts, academic, music |
| Bondi Junction, NSW | 5 | Academic, creative arts, music |
| Perth, WA | 5 | Academic, creative arts |
Two things stand out. The leaders are transport hubs and inner-city centres, not the leafy family suburbs you might expect — Southbank, Box Hill, Chatswood and Hornsby are all places families already travel to. And the absolute numbers are small: the best-served suburb in the country lists nine non-sport activities. This is a thin market everywhere.
Why this matters more in 2026 than it used to
Families are cutting activity spending, and sport is where the money is. Australian parents spend an average of $1,779 per child per year on extracurricular activities — about $4.7 billion nationally — and kids' sport alone runs to roughly $1,369 per child, close to double what it cost five years ago. More than half of Australian families report either cutting the household budget elsewhere or withdrawing a child from sport because of the cost, and 88% expect those costs to rise again this year.
The usual advice when sport gets too expensive is to find something cheaper. Our data says that in 74% of suburbs, there is no listed alternative to switch to — the choice is sport or nothing local. That is the part of the cost-of-living story that the household budget surveys do not capture.
If cost is the pressure rather than preference, start with our guide to what kids' sport actually costs in Australia, which covers the state voucher schemes that can pay for a season.
How to search when your suburb comes up empty
- Search the neighbouring suburb, not just your own. Non-sport activities cluster in centres. If you are in a sport-only suburb, the nearest transport hub is where the art studio or music school will be.
- Look at the category, not the keyword. "Drama", "pottery", "filmmaking" and "sewing" all sit under creative arts in our index — browsing the category surfaces things a keyword search misses.
- Check libraries and councils separately. Council-run holiday programs and library sessions are frequently free and are the single biggest source of non-sport activity for primary-age children. They are not always listed as businesses.
- Ask the school. Instrumental music programs, chess clubs and drama groups run inside schools do not appear in any activity directory.
You can browse everything we hold at kids' activities across Australia, and the full dataset behind this article is published as our Kids' Activity Index.
Frequently asked questions
What percentage of kids' activities in Australia are sport? Of the 7,949 activities listed on AroundSchools at 5 September 2026, 6,926 — or 87.1% — fall into a sporting category. Creative arts is second at 410 listings (5.2%), followed by academic and tutoring at 352 (4.4%).
Why are there so few music activities listed? Just 65 music activities are listed nationally, across only 60 suburbs. Private music teaching is dominated by sole traders who typically do not list in business directories, so this is partly a discoverability gap. It is still a fair reflection of how hard music is to find compared with junior sport.
Which state has the most non-sport options for kids? By share, the ACT at 15.1% and Queensland at 15.0%. By raw count, New South Wales has the most with 324 non-sport listings, followed by Victoria with 280. Tasmania is lowest by share at 11.2%.
My suburb has no non-sport activities listed. Does that mean there are none? Not necessarily. It means none are listed, which for a searching parent has much the same effect. Try the nearest town centre or transport hub, and check your local council and library programs, which are often unlisted and frequently free.
What is a good alternative to sport for a child who doesn't enjoy it? The three largest listed categories after sport are creative arts (drama, dance, art, pottery, filmmaking), academic and tutoring programs including STEM and coding, and entertainment-based activities such as play centres and adventure programs. Which travels best depends on your suburb — the table above shows where each clusters.
Activity figures are AroundSchools' own listings data, live as at 5 September 2026, and describe what is listed and findable rather than every activity that exists. Household spending figures are from ING and UNICEF Australia research published in 2026. Category counts overlap slightly where an activity belongs to more than one group.